Bad light first, unappetising food second
Here is the single most important number in the study: the average restaurant nails the technical part of a photo — sharp, in focus, correctly exposed — scoring 68% there. Modern phones made that problem go away. What a phone cannot fix by itself is the light and the frame: lighting scores 46%, the lowest of the five dimensions, and together with ordinary framing it drags appetite appeal down to 47% — whether the photo actually makes you want to order the dish.
That gap is the whole game. Appetite appeal is the most heavily weighted dimension on the rubric — 30 of the 100 points — because it is the only one a customer feels while going down the list. Restaurants upload whatever photo they happen to have: not judged objectively, not compared side by side, never measured against how the strongest competitors present the same dish. And if a photo doesn't catch the eye in a fraction of a second — Meta measured 1.7 seconds of attention per item in a mobile feed, and the first visual impression forms in roughly 50 milliseconds — the customer is already ordering from someone else.
The scorecard, by dimension
Average across 1357 restaurants · each dimension shown as a share of its maximum
Compliance (91%) and technical quality (68%) are near-universal — almost everyone clears them, so they don't separate one menu from another. The spread that decides who wins the grid lives in lighting (46%) and appetite appeal (47%) — and the first one causes the second.
Nine menus in ten score a C or worse
Distribution of the 1357 restaurants · median 57, range 5–87
Only three restaurants in 1,357 — 0.2% — produced menu photography that is genuinely appetising end to end. The overwhelming majority sit in a wide middle band: technically fine, commercially invisible.
And some menus don't have enough photos at all
Photo coverage on the live listing · 1,357 restaurants
Grading assumes there is something to grade. 17% of the restaurants in the sample (228 of 1,357) did not have even six usable dish photos on their listing, and 25 of them had fewer than three. A menu that offers the customer two pictures and forty lines of text is competing in a grid where every other tile has an image.
Where the platform exposed the whole menu (651 venues), listings carried 70 items on average — median 58 — and 88% of those items had a photo of some kind. The missing sliver is not spread evenly: 29% of those venues had ten or more dishes with no photo at all. On a delivery app, a dish with no photo is a dish that is not really on the menu.
By city
Average menu score in every city with at least 20 graded restaurants (23 of the 47)
Only cities with 20+ graded restaurants are broken out here — the other 24 cities in the study are counted in every total above, but an average over eight restaurants isn't a city average, so we don't print one.
What the top 1% do differently
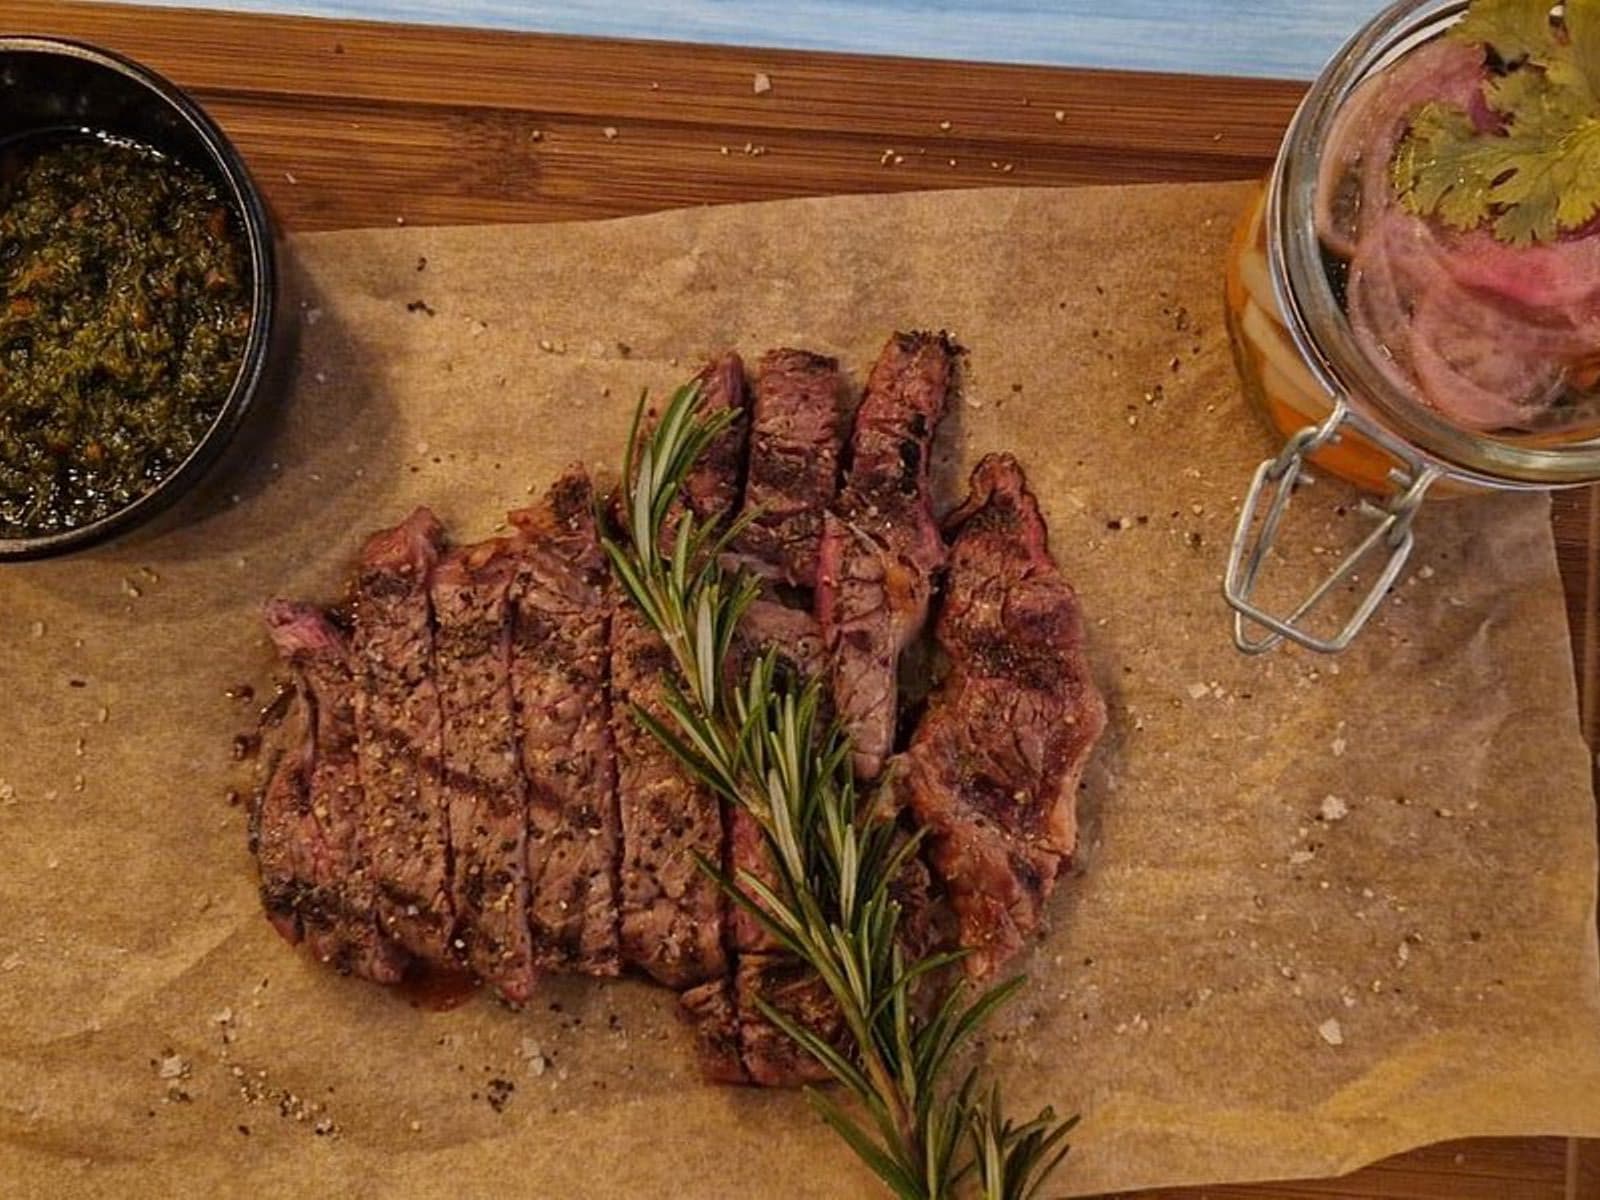
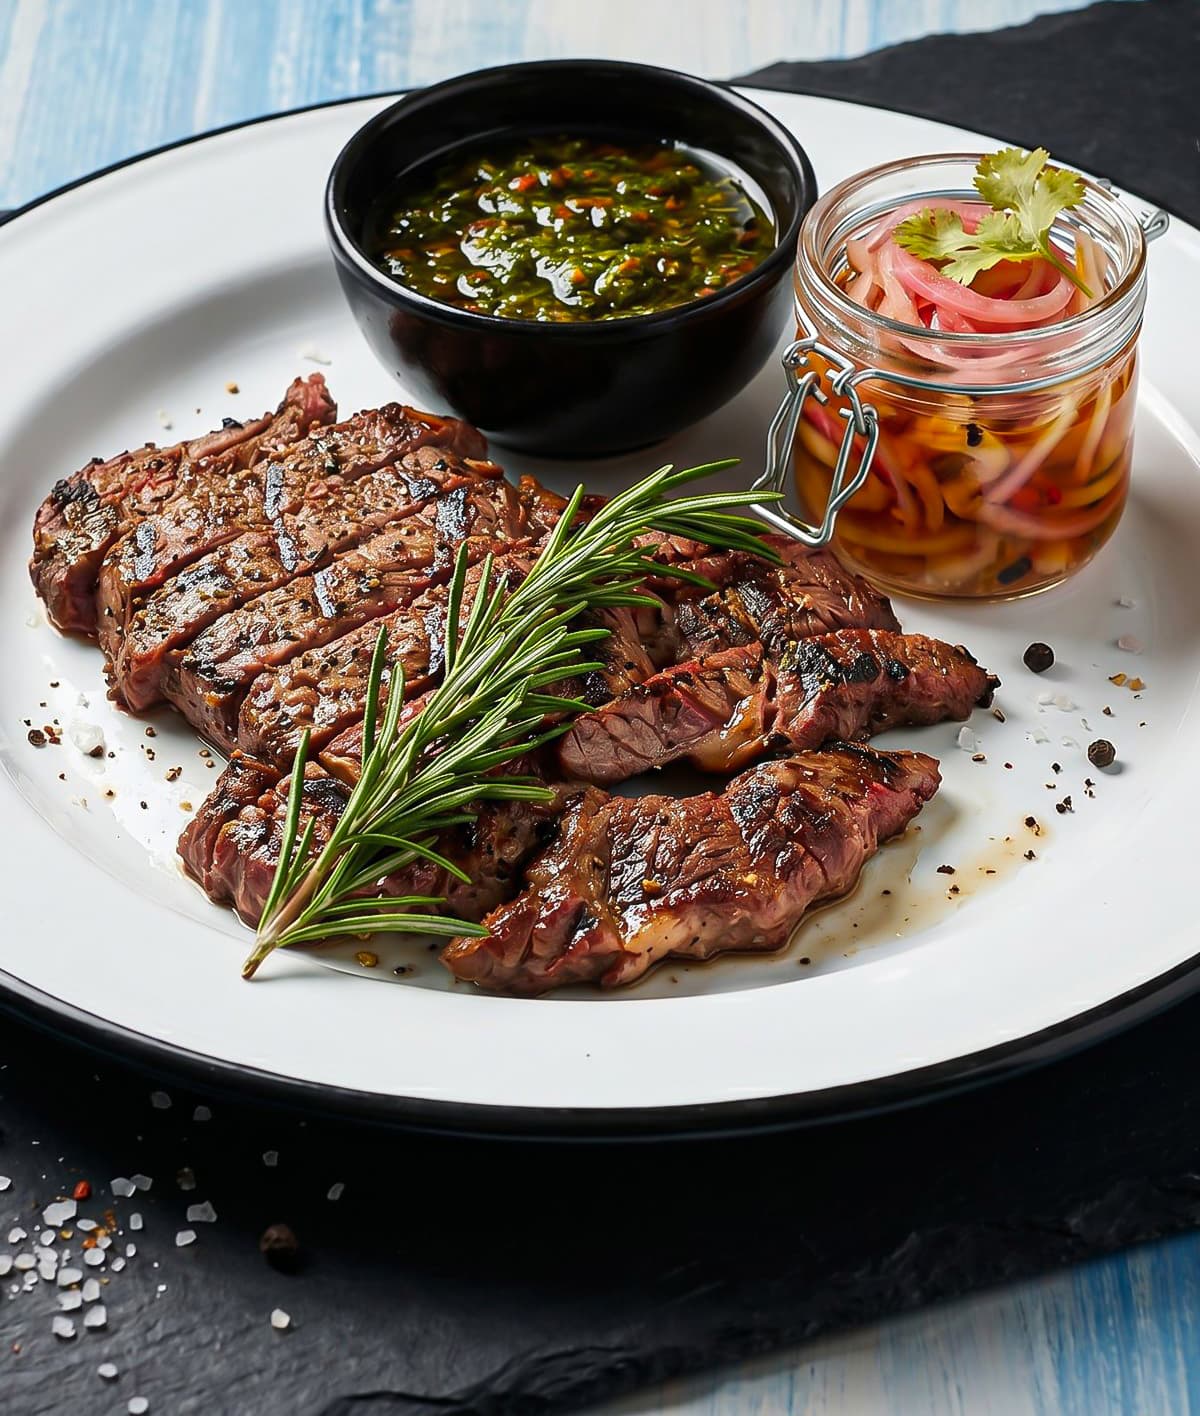
The restaurants that broke 85 didn't own better cameras — the whole field is already technically competent. They won on the two things the camera doesn't decide for you, light and framing:
- Light that shapes the food — a clear direction and soft falloff that gives sauce sheen, crust texture, and steam somewhere to live. Flat overhead phone light is the single most common failure.
- Framing that fills the plate — the dish is the hero, shot close, with the garnish and the best-looking side turned to camera. Weak menus shoot the whole table from a metre away.
- Colour that reads as fresh — warm, saturated, true-to-life tones instead of the grey-blue cast a phone throws under kitchen strip lighting.
None of that requires a photographer on site. It requires the light, colour and framing to be fixed after the shot — which is exactly the part software now does in seconds.
Methodology & limitations
- Sample. 1,357 restaurants listed on Wolt and Glovo across 47 European cities in 22 countries, graded July–August 2026. The grader scores an even spread of up to six dish photos per menu; drinks are excluded before scoring, and a venue with fewer than six usable photos is graded on what it has. Separately, for the 651 venues where the platform exposed it, menus listed 70 items on average and 88% of those items carried any photo at all.
- Grading. Each menu received a single 0–100 score from a five-part rubric — Appetite appeal (30), Lighting (25), Composition (20), Technical quality (15), Platform compliance (10) — the same rubric a professional food photographer uses to critique a shoot, applied by a vision model.
- Limitations. Two platforms (Wolt and Glovo) and a single automated grader. Venues are found by an automated sweep of city listings, so this is a broad sample rather than a census, and it over-represents restaurants that sell delivery. Numbers are a point-in-time snapshot and will shift as menus are updated. Not comparable with earlier editions (July 2026: 76 Lithuanian venues, average 67.4 · early August 2026: 387 European venues, average 60.0): the sample keeps widening across Europe and the grader changed how many photos it reads per venue, so the drift in averages is a change of sample and method, not evidence that restaurant photography got worse.
- No fabrication. Every figure on this page is measured from the data set above. The two attention figures quoted at the top are the only outside numbers, and they are attributed where they appear — Facebook IQ (1.7 seconds of attention per item in a mobile feed) and Lindgaard et al., 2006 (a visual first impression forms in about 50 ms). We publish the sample size openly rather than inflate it.
Questions
What is a good food-photo score on a delivery app?
On PlateRefresh's 100-point scale, anything above 85 is genuinely appetising work that pulls orders. In this study only 0.2% of restaurants cleared that bar — 3 out of 1,357. The average was 58 and 91% of menus scored below 70: passable, but not selling. A 'good enough' photo and a photo that makes someone hungry are two different things.
Why does food photography matter on Wolt, Bolt Food, or Glovo?
On a delivery app the photo IS the storefront — customers go through a grid of thumbnails and decide in a fraction of a second (Facebook IQ measured 1.7 seconds of attention per item in a mobile feed). There is no waiter, no smell, no plating in front of them. The single biggest lever a restaurant controls on that grid is how appetising each photo looks — and lighting and appetite appeal are exactly the two dimensions restaurants score worst on.
How was each restaurant scored?
Every menu was graded on a five-part photographer's rubric: Appetite appeal (30 points), Lighting (25), Composition (20), Technical quality (15), and Platform compliance (10). The grading ran on a vision model against the same rubric a professional food photographer uses to critique a shoot. Full method and limitations are in the Methodology section below.
Can I check my own restaurant's score?
Yes — the free Menu Scan grades your live delivery-app photos on the same 100-point rubric and shows you which dish is dragging your menu down, at no cost.